The Data of Chocolate


THE DATA OF CHOCOLATE
AGILE
Our team got a true, first-hand look at what it means to be agile. Throughout the semester and following the onset of COVID-19, the team executed an agile approach to project management – and life.
In the beginning of the semester, we utilized weekly project meetings, bi-weekly sprint reviews, and other integral meetups outside of these times along with constant communication throughout each week.
We assigned each group member a role that would contribute vastly to our success as a team. These roles consisted of a product owner, scrum master and developers.
The product owner was in charge of communicating with the client, while the scrum master was tasked with keeping the group in check including scheduling necessary meetings to carry out the deliverables.
This process proved to be very helpful for the team. It organized the project and broke it down into smaller deliverables rather than one finished product. This ensured that the group was carrying out the requests of the stakeholder along with remaining efficient.
Unfortunately, the current pandemic forced the group to give up in-person meetings and pick up working “together” through Zoom. Zoom is a meeting software which enabled us to conduct these meetings virtually. This was quite the transition, and it was tough adjusting to not being able to physically work with one another.
Along with this, the group was still enrolled in other classes online, so adjusting to the schedule difference was difficult.
Now, instead of meeting as a group when it was convenient, we were forced to nail down specific times to ensure the whole group could attend.
We learned true agility and resilience through this process – not just in project management, but in life.
TRELLO
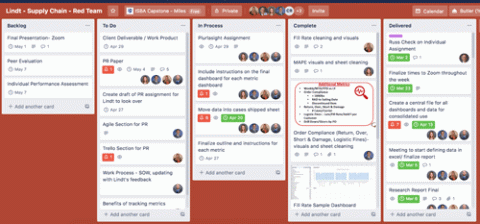
During this agile process we made a Kanban board on Trello. A Kanban board is a wonderful tool used in agile to track specific pieces of work and where they are at in the process. If you don’t have Trello to manage everything from work to your personal life – you’re going to want it.

In our Kanban Trello board, we used five columns: Backlog, To Do, In Process, Complete, and Delivered. Our scrum master would create cards with dates set to coincide with when the task was due and then assign it to a team member.
These cards were an excellent way to evenly distribute the work and made it so easy to move forward with the project one card at a time.
At the beginning of the semester, we started with all the tasks we had to complete in the Backlog column. The purpose of the rest of the columnswere super intuitive; each task got moved from To Do to In Process to Complete and finally Delivered when it was officially submitted.
The Kanban board was a great way to show the Client how far along we were in a process and made it easy for any of the group members to add more tasks at any point based on their feedback.
The Trello board made us more agile and far more organized.
METRICS
The metrics we utilized and modeled during this process were centered around the goal of gaining understanding of customer-related inefficiencies and performance. Oh, and chocolate.
These inefficiencies commonly faced by Consumer Product Goods manufacturers result in incurred late fees and other penalties that cost the company their time, money and customer satisfaction.
Utilizing provided data, the team was able to manipulate it and turn it into digestible (no pun intended), very useful information in the form of a comprehensive, interactive dashboard.
Mean absolute percent error (MAPE) was a useful metric in understanding planning-related pain points. This particular metric measures forecast accuracy, revealing the company’s ability to forecaste customer order quantities.
With one glance at the MAPE dashboard, you could identify which families’ order quantities were performing well (or not) and compare year over year performance.
The company could use this to prioritize orders, adjust production and mitigatefill rate penalties from those specific “poor performers.”
The on-time and in full (OTIF) metric was helpful in determining the fulfillment of customer orders and how well their channels of distribution for carrier performance were working for them. If there was an issue present in one place or another, this metric would be useful in pinpointing where corrective actions need to exist.
The fill-rate metric allows the company to better understand how they are meeting customer demand. This will aid the company in determining adjustment of stock levels, production of certain products or prioritization of fulfillment of specific family orders.
Lastly, the additional metrics portion of the dashboard was important for understanding order compliance such as return, over, short and damage as well as logistic fines.
Each of these metrics and visualizations will help the company understand the different pain points as it pertains to customer orders and fulfillment.
Becoming knowledgeable of these different metrics and utilizing interactive visualizations of such data will help the company combat late penalties and become more efficient as it pertains to the customer-side supply chain in the future.
WORK PROCESS
This capstone course not only helped us practice and perform our technical skills but also allowed us to work in a more professional, post-graduation environment.

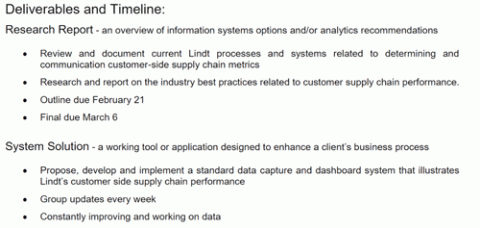
We used documents such as a Statement of Work or SOW to help define our deliverables, timeline, and project expectations. This document was flexible and allowed both teams and our client, Lindt (USA), to adjust the agreement of work to what was seen fit.
The partnership between the student run teams and Lindt (USA) continued throughout the semester. As the project developed, Lindt (USA) provided constant feedback and insight into what their final vision was. It also gave each student a chance to ask more questions and get a better understanding of the data being presented.
This communication took place at weekly meetings, one short meeting on Monday mornings and another on Thursday evenings.
After each of those, both teams took the individual feedback and implemented it into their version of the deliverable, allowing Lindt (USA) to personalize and refine the work done by the teams.
The final result was a culmination of student work and client feedback; the constant communication and review allowed Lindt (USA) to achieve a more specific and useful tool.
