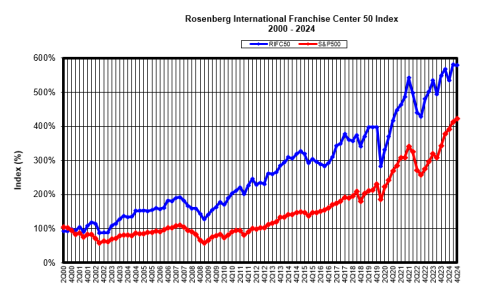
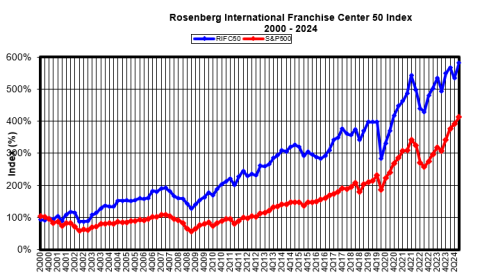
The RIFC 50 Index, initially published in 2002 by the Rosenberg International Franchise Center (RIFC), is the first stock index to track the financial market performance of the US franchising sector. It is published quarterly.
Second Quarter 2025
Car Rental Franchisors Bounce Back Strongly in 2Q 2025
The RIFC 50 Index gained 2.2 percent in market value in 2Q 2025, with 32 Index components posting positive returns, with 22 garnering double digit returns.
Car rental franchisors Avis Budget Group (CAR) and Hertz Global (HTZ) had very strong performances, up +123 percent and +74.8 percent, respectively. Both companies markedly improved their per-unit fleet depreciations and implemented cost control measures that significantly improved their profitability in 2Q 2025. Strong travel trends also helped boost car rental demand and revenues.
Krispy Kreme Donuts (DNUT) had the Index’ weakest performance in 2Q 2025, shedding 40.3 percent of its market value. It is facing a slew of challenges. With declining sales, it missed EPS expectations and lowered profit expectations for FY 2025. Its partnership with McDonalds was halted mid-Q2. It paused its dividend to conserve cash. And a federal investigation into accounting practices has unnerved investors.
The table below shows the market performance of the RIFC 50 Index and the S&P 500 Index over various time periods. For this second quarter of 2025, the S&P 500 had a very strong recovery after the tariff-driven slump early in the quarter, driven by strong momentum from the Big Tech companies.
Year to date, the RIFC 50 Index is up 3.3 percent while over 1-year, 5-years, and 10-years, the RIFC 50 Index returned +11.9%, +80.0%, and 87.0% respectively. Since its inception in 2000, it has gained 497.5%. Over these same time periods, the S&P 500 Index returned, respectively, +5.5%, +13.6, 100.1%, +200.8%, and +345.0%. It is to be noted that the exceptional performance of the S&P 500 Index in recent years has been mostly the result of the remarkable outperformance of a handful of mega cap technology companies (Apple, Amazon, Microsoft, Nvidia, etc.) that are not part of the franchise business sector.
| Period | RIFC 50 Index | S&P 500 Index |
|---|---|---|
| 2nd Quarter 2025 | +2.2% | +10.6% |
| 1-Year | +11.9% | +13.6% |
| 5-Year | +80.0% | +100.1% |
| 10-Year | +87.0% | +200.8% |
| Since Inception (2000) | +497.5% | +345.0% |
Note:The RIFC 50 Index is updated quarterly. For more information, contact Dr. E. Hachemi Aliouche, Director, Rosenberg International Franchise Center.

First Quarter 2025
The RIFC 50 Index Turns Positive While Financial Markets Stumble in 1Q 2025
The RIFC 50 Index gained 1.1 percent in market value in 1Q 2025, driven by a strong rebound of the food sector (+6.8 percent). Many of the large food franchisors had robust financial returns, including Yum!Brands (+17.2%), Brinker (+12.7%), and McDonald’s (+7.7%). However, many of the smaller food franchisors took heavy losses, including Krispy Kreme (-50.3 percent) and Red Robbin Gourmet Burgers (35.2- percent).
The franchised lodging sector underperformed this quarter, dropping 12.4 percent in market value. Marriott International and Hyatt were particularly hit, losing 14.6 percent and 22.5 percent of their respective market values, following disappointing financial results, in addition to the negative impacts of a more bearish overall market sentiment. This downbeat market sentiment was reflected in the S&P 500 Index loss of 4.6 percent in market value. .
The table below shows the market performances of the RIFC 50 Index and the S&P 500 Index over various time periods. For this first quarter 2025, the RIFC 50 Index significantly outperformed the S&P 500 Index (+1.1% vs. -4.6%). Over 1-year, 5-years, and 10-years, the RIFC 50 Index returned +3.1%, +106.2%, and 78.9% respectively, while it gained +484.8% since its inception in 2000. Over these same time periods, the S&P 500 Index returned, respectively, +6.8%, +117.1%, +171.4%, and +302.4%. It is to be noted that the exceptional performance of the S&P 500 Index in recent years has been mostly the results of a handful of mega high-tech companies that are not part of the franchise business sector.
| Period | RIFC 50 Index | S&P 500 Index |
|---|---|---|
| 1st Quarter 2025 | +1.1% | -4.6% |
| 1-Year | +3.1% | +6.8% |
| 5-Year | +106.2% | +117.1% |
| 10-Year | +78.9% | +171.4% |
| Since Inception (2000) | +484.8% | +302.4% |
Note: The RIFC 50 Index is updated quarterly. For more information, contact Dr. E. Hachemi Aliouche, Director, Rosenberg International Franchise Center.
Fourth Quarter 2024
RIFC 50 RIFC 50 Index Slightly Down 4Q 2024 Despite Lodging Sector Strong Performance
A The RIFC 50 Index dropped slightly (-0.4%) in the fourth quarter 2024, dragged down by the food sector (-3.5%). Notable negative performers this quarter include Wingstop WING (-31.2%) and McDonald’s (-2.9%). Most of the Index components (27 out of 50) lost market value this quarter, with 12 components experiencing double-digit losses.
Despite a generally challenging food sector, Dutch Brothers (BROS), the franchisor and operator of drive-through coffee shops, continues to deliver an outstanding financial performance as it jumped 110.5% this quarter, making it the best performer of the Index. Dutch Brothers continues to grow revenue quickly and to exceed growth and profit expectations.
The Lodging sector performed much better than the Food sector this quarter as it gained 7.3% in market value. In this sector, Wyndham Worldwide (WH) was the best performing component this quarter with a 24.4% gain.
For the full year 2024, the RIFC 50 Index gained 5.4%, propelled by the Lodging sector. Whereas the Food sector was up only 0.2% and the Services sector was up only 0.5%, the Lodging sector jumped 21.9% in 2024. Hilton Hotels (HLT) was the best performer in 2024 in the Lodging sector, gaining over 31% in market value.
The S&P 500 Index had a positive return this quarter with a 2.1% gain. As in recent quarters, this outperformance over the RIFC 50 Index was mostly due to the Magnificent Seven mega high-tech companies Alphabet, Amazon, Apple, Meta Platforms, Microsoft, Nvidia, and Tesla) and the enthusiasm of investors for companies with Artificial Intelligence capabilities.
Over 1-year, 5-years, and 10-years, the RIFC 50 Index returned +5.4%, +45.3%, and 81.1% respectively, while it returned +478.4% since its inception in 2000. Over these same time periods, the S&P 500 Index returned, respectively, +23.3%, +82.6%, +185.7%, and +321.8%. It is to be noted that the exceptional performance of the S&P 500 Index in recent years has been mostly the results of a handful of mega high-tech companies that are not part of the franchise business sector.
RIFC 50 Index and S&P 500 Index: Total Returns
| Period | RIFC 50 Index | S&P 500 Index |
|---|---|---|
| 4th Quarter 2024 | -0.4% | +2.1% |
| 1-Year | +5.4%% | +23.3% |
| 5-Year | +45.3% | +82.6% |
| 10-Year | +81.1% | +185.7% |
| Since Inception (2000) | +478.4% | +321.8% |
Note: The RIFC 50 Index is updated quarterly. For more information, contact Dr. E. Hachemi Aliouche, Director, Rosenberg International Franchise Center.
Third Quarter 2024
RIFC 50 Index Gains 8.8% in Market Value in 3Q 2024
• Majority of Index components gained value (30 out of 50) – most by double digits Driven by food sector (+11.1%)
• All hotel franchisors performed positively this quarter
• RIFC 50 Index outperformed S&P 500 Index this quarter (+8.8% vs. +5.5%) – as the mega high-tech companies in the S&P 500 (Magnificent 7) did not have outsize performances as in previous several quarters
• RIFC 50 Index is still outperforming S&P 500 since inception in 2000.
| Period | RIFC 50 Index | S&P 500 Index |
|---|---|---|
| 3rd Quarter 2024 | +8.8% | +5.5% |
| 1-Year | +11.7% | +34.4% |
| 5-Year | +46.2% | +93.6% |
| 10-Year | +89.8% | +192.2% |
| Since Inception (2000) | +480.9% | +312.2% |
Note:The RIFC 50 Index is updated quarterly. For more information, contact Dr. E. Hachemi Aliouche, Director, Rosenberg International Franchise Center.


